Harness Event Data for Better Planning: 4 Essential Big Data Strategies
You know that collecting big data is a major trend in the event planning industry. The marriage of technology and attendee-centric event planning can create experiences that engage event participants in revolutionary ways.
But how do you leverage big data to boost success and revamp your events, so the numbers lead to strategic design improvements? Here, we explore a mix of straightforward and showstopping ways to use big data before, during, and after events so attendees”and your clients”notice and remember.
Here’s how to use big data for better events:
1. Use event data to create personalized attendee experiences
Experiential marketing is on-trend right now, and this is music to the ears of event planners everywhere. The latest tech trends, such as RFID, VR, iBeacon, and geolocation, let you plan unique experiences for participants of your events. RFID chips can be embedded in a variety of objects, such as name badges, lanyards, labels, and keychains, making them an easy, scalable option.
Some examples of trending event data experiences:
- Use RFID-enhanced name badges to provide access to specific information and prizes, depending on the attendee’s location. When within range, pertinent information pops up on a smartphone, allowing the attendee to explore further.
- Send attendees on a scavenger hunt through vendor booths: A digital map marks checkpoints where interactive games, puzzles, and relevant downloadable materials become available.
- Create user-specific suggestions based on pre-event questionnaires. Each attendee receives a personalized guide to the venue with relevant vendors or sessions marked. In this way, participants can see only and precisely what is relevant to them, and customize their experience to suit personal needs.
- Boost networking opportunities with notifications when guests with similar schedules or interests are within range of each other during cocktail hour or breaks.
- Facilitate connections with e-business cards that attendees can swap, collect, and view in the event app (bonus points for a scan-to-store option that files digital versions of paper cards). Gain insight into networking opportunities and successes by tracking how many people access the cards and make contact after the event.
- Let attendees’ badges or wristbands do the work: Cashless payment is quick, easy, safe”and boosts event day sales. And, lost badges can be deactivated instantly for security.
- Open doors for attendees”literally”with VIP-area access granted by RFID, beacon, or Bluetooth proximity.
- Encourage participation with RFID gamification. Allow attendees to earn upgrades based on activity check-ins, submit tagged scavenger hunt photos to a live feed, earn drink vouchers based on surveys completed, or win prizes after checking in at vendors’ booths.
- Increase lead generation with QR codes to use with scan-and-subscribe offerings.
- Trigger notifications based on location data if a relevant seminar is about to open. Or give attendees notice if the bathroom they’re heading towards has a line.
2. Use data to make in-the-moment event adjustments
Collect big data in real-time to crowdshape your events. A relatively subtle process, crowdshaping harnesses the newest and latest technology trends to detect everything from an attendee’s location to their heart rate.
This knowledge helps you determine when attendees are engaged during an event”and when they’re disengaged. You can then make changes to signage, create new calls to action, or even adapt the event schedule to better accommodate the demands of attendees.
This data-collecting strategy can include both active and passive participation.
Active participation engages the attendee in an activity, such as conducting surveys on the exhibitor floor, requesting feedback through an event app after sessions let out, or otherwise requesting a response from a person.
Passive participation collects data as the person moves through the event without asking for input.
Put both to work with these strategies:
- Use your event app to ask real-time questions. These may reveal gaps in communication, including information that’s difficult to find or you’ve forgotten to share. If the same question pops up often, you may need to update the website or make a special announcement.
- Keep an eye on popular areas with heat mapping or wearable technology. Extend the length of time a particular activity is open based on attendance levels and inform attendees via text.
- Adjust the table layout for subsequent days based on morning seating preferences. Were most tables filled with small groups? Break large blocks of tables into smaller sections. If large groups pushed together smaller tables, make the change yourself the next day.
- Open additional check-in locations to contend with long lines.
- Make main entrance signage easier to spot if attendees often enter via the wrong door or miss the registration area.
Emotional data may help improve offerings for a more engaging experience. Data collected by analyzing facial expressions can reveal how interested attendees really were. Facial expression data can provide insight into what sessions were the most engaging, how invested the attendees were, and whether they remained focused or became fidgety.
Observing voice patterns can cue speakers and staff in on whether their tone is hitting the mark.
A speaker could use this technology to analyze their own voice, so they adjust their tone, inflection, or energy as necessary to properly engage later audiences.
Voice analysis of on-the-floor attendee surveys can help determine specific timing or events that account for a loss of interest or dip in the overall impression. Negative states often align with pre-lunch hour hunger or afternoon fatigue rather than displeasure. Positive states are usually influenced by energetic speakers and engaging sessions, or peak after coffee breaks and food service.
3. Pinpoint (and ease) crowd-flow issues
Geolocation goes further than being able to tell you where one specific individual is located at your event. Modern technology allows for meeting planners to know crowd densities as well. Having this information puts planners in charge of crowd flow in an unprecedented way. Over time, information of this nature can influence how you design future event spaces and can help maximize design concept, management, and flow.
- If attendees cluster around the perimeter of the venue searching for outlets, add charging stations to the lounge area or other seating areas.
- Long lines at check-in could signal the need for additional entrances or a modified check-in solution.
- Attendees who wander without an obvious destination may need better signage to direct them to the appropriate locations. They may be searching for signage for the exhibitor hall, seminar locations, lounge areas, coffee carts, or bathrooms.
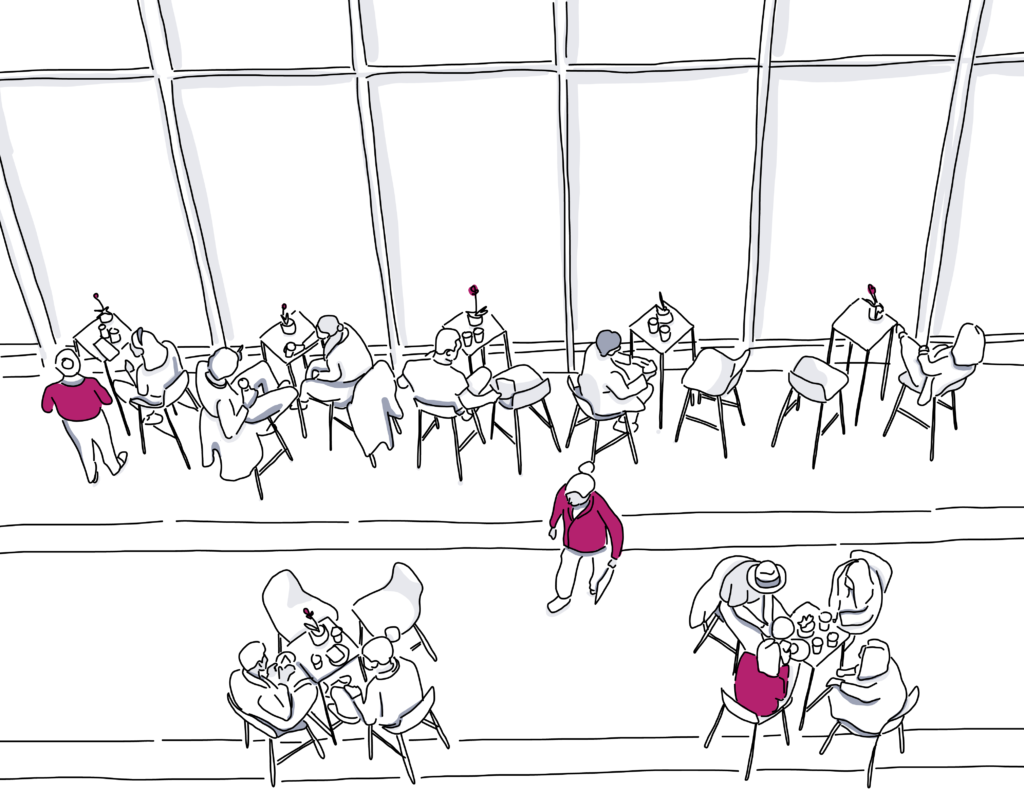
- Track seating trends to find largely unseated areas, gaps in seating, or oversaturated spaces and diagnose reasons people choose one location over another. It could be as simple as a loud vent, drafty window, or poor lighting.
- Buffet tables with longer lines run out of food faster. Observe traffic flow data to ensure the busiest areas are refilled more often.
4. Lock-down better event safety procedures and travel needs
In addition to making sure that each part of your event gets equal engagement, knowing how and where your event population moves can help to improve safety procedures. Crowdshaping data can include physiological and biological information about attendees. This can revamp how planners approach everything from food restrictions and allergies to moving crowds through exposed, outdoor spaces in inclement.
Cisco Global Sales Experience (GSX) kept an eye on attendees’ locations with individual tracking badges. This increased security by notifying staff if someone accessed restricted areas. The badges also tracked attendance at mandatory training events and kept an eye on the most popular areas to prevent overcrowding.
Looking at historical data can provide insight and help predict future trends, such as attendees skipping parking lots in favor of public transportation, an increase in overnight stays versus daily commuters for a multi-day event, or groups opting to leave the venue for meals rather than eating on-site.

The essential ˜big data’ points for events”and how to use what you learn:
When using data analytics for event planning, focus on the points that matter. Use these stats to gain insight about how attendees interact with your brand, who is most engaged, where you really struck a chord, and where to improve.
Basic attendee information
Start small: Gather basic statistics about your attendees for valuable details that become especially helpful over subsequent years.
Track returning vs. new attendees to keep an eye on the big picture. If your number of returning attendees is low, where are they losing interest? How can you draw them back? If you have a high number of returning attendees, but no new faces, how can you attract a new audience?
Consider whether new attendees are familiar with your business or have only just found you. Have they attended other events you’ve hosted? Made purchases? Reached out to make contact or ask questions? Are they a member or supporter of the umbrella organization?
Pay attention to any declines in attendance that could signal the need for a refresh in theme, venue, or marketing strategy.
Registration and attendance trends
Use your event check-in stats to explore the number of tickets sold versus redeemed. Is there a discrepancy?
Are people attending the event, but missing the check-in area? This may be a clue to adjust registration locations or add additional check-in stations.
Are people registering but not attending? Send out reminder emails prior to the event. Additionally, follow up with the absent registrants to find out why they didn’t show up.
Look at when, how, and where attendees bought their tickets or registered. Did certain pricing strategies give a sales boost? Or, did a raise in ticket price deter attendees? Adjust your pricing as needed, and target your promotions where attendees are the most responsive.
Attendee experience
Regardless of what kind of event you’re planning”a meeting, incentive trip, fundraising dinner, or industry conference”the best barometer of success is attendee satisfaction. Happy attendees are repeat attendees, and repeat attendees are often ambassadors and champions of your brand.
When gauging attendee satisfaction, consider all aspects of the event including:
- Venue: Was the venue convenient, accessible, ˜Instagrammable,’ and large enough?
- Location: Are there hotels and restaurants nearby? What is the surrounding area like?
- Transportation: Is the location near an airport or train station for out-of-town attendees? Is there ample parking and public transportation? What is the traffic situation?
- Food: Did the catering meet expectations? How was the dining experience? Would an extra coffee break have helped attendees whose energy dipped after lunch?
- Sessions, activities, and schedule: What kept attendees engaged, interested, and entertained? Or, did the agenda fall flat?
- Overall satisfaction: Was satisfaction high even if attendees weren’t thrilled with the lunch options or if they missed their shuttle? Look at the overall picture in addition to the pieces.
Tools and strategies to assess attendee satisfaction:
- Use an app for live polling throughout the day to rate speakers, sessions, and unexpectedly popular offerings. The interactivity of polls can boost engagement levels, too.
- Watch social feeds and compare the volume against check-in statistics. Which sessions were most popular? Which didn’t have as many attendees as expected? Did the social media chatter match up with attendance statistics?
- Post-event surveys can gauge satisfaction. Glean information about the event, and follow up with unhappy attendees to see how to turn the experience around.
- Explore social media feeds for additional information. Attendees may post about their bad experiences rather than fill out a survey. Odds are good they’ll take to their accounts to show off the good time they’re having as well.
Net Promoter Score
Happy attendees are more likely to recommend your events to colleagues and friends. Gauge the Net Promoter Score (NPS) of your attendees with a survey. This can be as simple as How likely are you to recommend this event to a friend? Or, you can send out a detailed questionnaire that digs into specific event areas.
Answers options are on a scale of 0 to 10. Tally up the answers to find your promoters by taking the percentage of 9 and 10 responses and subtracting the percentage of 6 and below responses. Other than to calculate your percentages, ignore 7 and 8 responses. This figure is your NPS.
Let’s take a look at an example:
| Response Tallies | |||||||||||
| Score | 10 | 9 | 8 | 7 | 6 | 5 | 4 | 3 | 2 | 1 | 0 |
| # | 197 | 158 | 170 | 95 | 59 | 41 | 17 | 1 | 2 | 1 | 1 |
- 48% of total responses were Promoters, your brand champions
- 16% of total responses were Detractors, unhappy attendees
NPS Formula: NPS = Percentage of Promoters – Percentage of Detractors
Therefore, 48 percent minus 16 percent equals an NPS of +32. Scores can range from -100 to +100, with an average NPS score of +32. A ˜good’ score means different things across different industries. The Net Promoter Score is not a standalone measure of event success”but it is a helpful number to keep in mind. The real value in the NPS survey may be in the additional information you can get by asking the motivation behind the rating.
Event engagement
Engagement not only reflects the experience your attendees had but can impact word of mouth advertising and long-term buzz. Across social profiles, keep an eye on your branded hashtags, watch for retweets, check-ins, and @ mentions. Ensure there’s content available for people to find and share, as well. Let your available posts stir pre- and post-event engagement.
Another measure of engagement is the number of profile and event page views you’re getting. They’ll naturally creep up as the event approaches, but no increase or a decrease could signal a visibility problem.
Are people getting the information they need? If event-specific questions are the main engagement you’re getting, update your website or consider developing content that addresses these questions.
Look to exhibitors for clues on attendee engagement. Was there a lull in visitors, or were people skipping booths due to overcrowding? What did they notice about interest levels, engagement, and satisfaction? Exhibitors have seen plenty of trade show floors, so seek their feedback.
Consider the number of late arrivals and early departures. Are people leaving because the sessions weren’t engaging? Are people showing up late because the start time is inconvenient? Solutions may include adjusting the schedule, shifting the lineup of speakers, or reminding registrants about check-in times in pre-event emails.
Answer data privacy concerns to keep attendee information safe
Gathering data means you also have an obligation to keep that information safe. First, be 100 percent transparent on the data you’re collecting and how you intend to use it. Keep data private all the way from registration through event day:
- Use a secure registration and ticketing system.
- Keep your event technology up to date.
- Ensure your privacy policy discloses the information you’re collecting and who you share it with.
- Check to ensure the venue’s Wi-Fi network is secure
- Allow attendees to opt-out of any data collection”and honor those requests.
Have more questions about big data in the events industry?
Big data consists of extremely large data sets that are analyzed computationally to reveal patterns, trends, and associations, especially as it relates to human behavior and interactions.
In the event industry, big data is used to collect information about how customers interact with events, and the conclusions drawn ultimately influence how events are planned and designed. Using big data allows event planners and venues to better understand attendees and their behaviors, and enables events to become even more impactful.
Bring better events to life by applying data learnings:
No two attendees have the same experience at an event. Collecting event-based data helps planners make adjustments to the overall event and attendee communications”quickly and efficiently. This helps you design safer, easier-to-navigate event spaces, boosts personalization, and makes attendees happier. That’s a lot of valuable ROI.
Inspired to design better events through data? Explore event management software that helps keep your data collection and analytics organized so it doesn’t fall through the cracks. Or, get up to speed on more event trends shaking up meetings and group business in 2020.

